Soil erosion has become a critical problem leading to land degradation and environmental risks globally. To grasp the rates of soil loss and identify the main factors driving these issues, it is vital to examine the specific impacts of soil erosion across different locations. Therefore, between 2021 and 2023, a research initiative was undertaken to assess, rank, identify, and map sections of the watershed that are particularly susceptible to soil erosion. The RUSLE components for factors R, K, L, S, C, and P were integrated using the ArcGIS 10.4.1 spatial analyst's raster calculator tool to calculate and create maps that illustrate the risk and intensity of soil erosion in the Dhumuga watershed. The Dhumuga watershed was categorized into five groups based on average annual soil loss: 0–5 ton/ha-1 year-1 (very slight), 5–10 ton/ha-1 year-1 (slight), 10–20 ton/ha-1 year-1 (moderate), 20–50 ton/ha-1 year-1 (high), and > 50 ton/ha-1 year-1 (very high). The assessment of soil erosion severity was influenced by factors such as rainfall, soil type, DEM, land use, and land cover, employing the GIS-based RUSLE equation. The spatial risk of soil erosion was sorted into five categories based on severity, with 11.58% of the area categorized as very high risk (>50 ton ha-1 year-1), and 54.2% in the very low to low-risk category. On average, the watershed yielded an annual sediment production of up to 13.94 tons/ha/year, which is within an acceptable range. Considering these research findings, GIS-based analyses can be utilized to pinpoint areas at risk of soil erosion and identify vulnerable zones, offering crucial insights for future soil conservation and model enhancement.
| Published in | American Journal of Environmental Science and Engineering (Volume 8, Issue 4) |
| DOI | 10.11648/j.ajese.20240804.12 |
| Page(s) | 100-106 |
| Creative Commons |
This is an Open Access article, distributed under the terms of the Creative Commons Attribution 4.0 International License (http://creativecommons.org/licenses/by/4.0/), which permits unrestricted use, distribution and reproduction in any medium or format, provided the original work is properly cited. |
| Copyright |
Copyright © The Author(s), 2024. Published by Science Publishing Group |
Dhumuga-Watershed, Erodibility, Erosivity, Land Use Change, GIS
Erosion categories | Soil loss (tons/ha/year) | Area in ha | Percentage |
|---|---|---|---|
Very low | <5 | 78.43075 | 13.9 |
Low | 5-10 ton | 227.39275 | 40.3 |
Moderate | 10-20 ton | 150.65475 | 26.7 |
High | 20-50 ton | 42.4316 | 7.52 |
Very high | >50 ton | 65.34015 | 11.58 |
DEM | Digital Elevation Model |
EMA | Ethiopian Meteorological Authority |
ERDAS | Earth Resource Data Analysis System |
GIS | Geographic Information System |
GPM | Global Precipitation Measurement |
NASA | National Aeronautics and Space Administration |
RUSLE | The Revised Universal Soil Loss Equation |
USLE | Universal Soil Loss Equation |
USPED | Unit Stream Power Erosion and Deposition |
| [1] | Hurni, H., Tato, K. and Zeleke, G., 2005. The implications of changes in population, land use, and land management for surface runoff in the upper Nile basin area of Ethiopia. Mountain research and development, 25(2), pp. 147-154. |
| [2] | Ayenew, M. M. and Kopainsky, B. 2014. Food insecurity in Ethiopia: population, food production and market. In Proceedings of the 32nd international conference of the system dynamics society, Delft. The Netherlands. |
| [3] | Bewket, W. and Teferi, E., 2009. Assessment of soil erosion hazard and prioritization for treatment at the watershed level: case study in the Chemoga watershed, Blue Nile basin, Ethiopia. Land degradation & development, 20(6), pp. 609-622. |
| [4] | Mitiku, H., Herweg, K. G. and Stillhardt, B. 2006. Sustainable land management: a new approach to soil and water conservation in Ethiopia, Centre for Development and Environment (CDE) and National Centre of Competence in Research (NCCR) North-South, pp. 304. |
| [5] | Kirui, O. K. and Mirzabaev, A. 2014. Economics of land degradation in Eastern Africa, ZEF Working Paper Series, No. 128, University of Bonn, Center for Development Research (ZEF), Bonn. Available at: |
| [6] | Morgan, R. and J. Duzant, Modified MMF (Morgan–Morgan–Finney) model for evaluating effects of crops and vegetation cover on soil erosion. Earth Surface Processes and Landforms: The Journal of the British Geomorphological Research Group, 2008. 33(1): p. 90-106. |
| [7] | Demeke AB. 2003. Factors influencing the adoption of soil conservation practices in North-western Ethiopia. Discussion Papers (Germany). |
| [8] | Atoma, H., Suryabhagavan, K. V. and Balakrishnan, M., 2020. Soil erosion assessment using RUSLE model and GIS in Huluka watershed, Central Ethiopia. Sustainable Water Resources Management, 6(1), p. 12. |
| [9] | Soboka M., Dibaba R., Abera T., 2023. Socio-economic characterization, identification and prioritization of major constraints in Dhumuga learning Watershed, Ambo Ethiopia. Gizaw Tesfaye, Samuel Diro, Tesfaye Yaekob, Tesfaye Shimbir and Temesgen Desalegn (eds.) 2023. Proceedings of the Climate Action through Landscape Management (CALM) P4R Completed Research Activities Volume I. Ethiopian Institute of Agricultural Research (EIAR), Addis Ababa, Ethiopia. |
| [10] | Balasubramani, K. "Assessment of Watershed Resources for Sustainable Agricultural Development: a Case of Developing AN Operational Methodology Under Indian Conditions Through Geospatial Technologies." The International Archives of the Photogrammetry, Remote Sensing and Spatial Information Sciences 42 (2020): 9-13. |
| [11] | Renard, K. G., Predicting soil erosion by water: a guide to conservation planning with the Revised Universal Soil Loss Equation (RUSLE). 1997: US Department of Agriculture, Agricultural Research Service. |
| [12] | Wischmeier, W. H. and D. D. Smith, Predicting rainfall erosion losses: a guide to conservation planning. 1978: Department of Agriculture, Science and Education Administration. |
| [13] | Prasannakumar, V., et al., Estimation of soil erosion risk within a small mountainous sub-watershed in Kerala, India, using Revised Universal Soil Loss Equation (RUSLE) and geo-information technology. Geoscience frontiers, 2012. 3(2): p. 209-215. |
| [14] | Farhan, Y. and S. Nawaiseh, Spatial assessment of soil erosion risk using RUSLE and GIS techniques. Environmental Earth Sciences, 2015. 74: p. 4649-4669. |
| [15] | Foster, G., et al., User’s guide—revised universal soil loss equation version 2 (RUSLE 2). USDA–Agricultural Research Service, Washington, DC, 2002. |
| [16] | Maqsoom, A., et al., Geospatial assessment of soil erosion intensity and sediment yield using the revised universal soil loss equation (RUSLE) model. ISPRS International Journal of Geo-Information, 2020. 9(6): p. 356. |
| [17] | Morgan, R. P. C. D., D. A., Soil erosion and conservation. 1991: Longman Group: London, UK. |
| [18] | Kenneth, G. R., et al., RUSLE: Revised universal soil loss equation. J. Soil Water Conserv, 1991. 46: p. 30-33. |
| [19] | Pelton, J., E. Frazier, and E. Pickilingis, Calculating slope length factor (LS) in the revised Universal Soil Loss Equation (RUSLE). 2012. |
| [20] | Bekele, Bagegnehu, and Yenealem Gemi. "Soil erosion risk and sediment yield assessment with universal soil loss equation and GIS: in Dijo watershed, Rift valley Basin of Ethiopia." Modeling Earth Systems and Environment 7, no. 1(2021): 273-291. |
| [21] | Simms, K., Paul Ricoeur. 2003: Routledge. |
| [22] | Haregeweyn, N., et al., Comprehensive assessment of soil erosion risk for better land use planning in river basins: Case study of the Upper Blue Nile River. Science of the Total Environment, 2017. 574: p. 95-108. |
| [23] | Meshesha, D. T., A. Tsunekawa, and M. Tsubo, Continuing land degradation: cause–effect in Ethiopia's Central Rift Valley. Land degradation & development, 2012. 23(2): p. 130-143. |
| [24] | Ganasri, B. and H. Ramesh, Assessment of soil erosion by RUSLE model using remote sensing and GIS-A case study of Nethravathi Basin. Geoscience Frontiers, 2016. 7(6): p. 953-961. |
| [25] | Maetens, W., et al., Effects of land use on annual runoff and soil loss in Europe and the Mediterranean: A meta-analysis of plot data. Progress in Physical Geography, 2012. 36(5): p. 599-653. |
| [26] | Erol, A., Koşkan, Ö. and Başaran, M. A., 2015. Socioeconomic modifications of the universal soil loss equation. Solid Earth, 6(3), pp. 1025-1035. |
| [27] | Mekelle, E., Assessing Runoff and soil erosion by water using GIS and RS techniques at Midmar Catchment, Northern Ethiopia BY: Tsegay Aregawi Gebremedhn. 2015, PhD Thesis, Mekelle University. |
| [28] | Tadesse, L., Assessing the impact of watershed development programs on soil erosion and biomass production using remote sensing and GIS: the case of Yezat Watershed, West Gojam Zone of Amhara Region, Ethiopia. West Gojam Zone of Amhara Region. Addis Ababa University, 2016. |
| [29] | Obaid, H. and S. Shahid, Soil erosion susceptibility of Johor River basin. Water and Environment Journal, 2017. 31(3): p. 367-374. |
| [30] | Mohammed, M., B. Biazn, and M. D. Belete, Hydrological impacts of climate change in Tikur wuha watershed, Ethiopian rift valley basin. J Environ Earth Sci, 2020. 10(2): p. 28-49. |
| [31] | Mohammed, M., D. Bekele, and M. Bazie, Baseline socioeconomic characterization and resource use of the community in the Mefakiya watershed. Frontiers in Sustainable Food Systems, 2024. 8: p. 1347866. |
| [32] | Gashaw, T., et al., Evaluating potential impacts of land management practices on soil erosion in the Gilgel Abay watershed, upper Blue Nile basin. Heliyon, 2020. 6(8). |
| [33] | Getnet, T. and A. Mulu, Assessment of soil erosion rate and hotspot areas using RUSLE and multi-criteria evaluation technique at Jedeb watershed, Upper Blue Nile, Amhara Region, Ethiopia. Environmental Challenges, 2021. 4: p. 100174. |
| [34] | Hurni, H., et al., Land degradation and sustainable land management in the highlands of Ethiopia. 2010. |
| [35] | Yimam, M. M. and S. Bezabih, Gully Erosion Hot Spot Area Mapping For Its Control Mechanism At Hashenge Lake Watershed, Southern Tigray, Ethiopia. Results of Natural Resources Management Research, 2020. |
| [36] | Hurni, H., et al., Soil erosion and conservation in global agriculture. Land use and soil resources, 2008: p. 41-71. |
APA Style
Soboka, D. M., Mohammed, M. (2024). Spatial Assessment of Soil Erosion Risk Using RUSLE and GIS in Dhumuga Watershed, Ambo, Ethiopia. American Journal of Environmental Science and Engineering, 8(4), 100-106. https://doi.org/10.11648/j.ajese.20240804.12
ACS Style
Soboka, D. M.; Mohammed, M. Spatial Assessment of Soil Erosion Risk Using RUSLE and GIS in Dhumuga Watershed, Ambo, Ethiopia. Am. J. Environ. Sci. Eng. 2024, 8(4), 100-106. doi: 10.11648/j.ajese.20240804.12
AMA Style
Soboka DM, Mohammed M. Spatial Assessment of Soil Erosion Risk Using RUSLE and GIS in Dhumuga Watershed, Ambo, Ethiopia. Am J Environ Sci Eng. 2024;8(4):100-106. doi: 10.11648/j.ajese.20240804.12
@article{10.11648/j.ajese.20240804.12,
  author = {Diriba Megersa Soboka and Mekin Mohammed},
  title = {Spatial Assessment of Soil Erosion Risk Using RUSLE and GIS in Dhumuga Watershed, Ambo, Ethiopia
},
  journal = {American Journal of Environmental Science and Engineering},
  volume = {8},
  number = {4},
  pages = {100-106},
  doi = {10.11648/j.ajese.20240804.12},
  url = {https://doi.org/10.11648/j.ajese.20240804.12},
  eprint = {https://article.sciencepublishinggroup.com/pdf/10.11648.j.ajese.20240804.12},
  abstract = {Soil erosion has become a critical problem leading to land degradation and environmental risks globally. To grasp the rates of soil loss and identify the main factors driving these issues, it is vital to examine the specific impacts of soil erosion across different locations. Therefore, between 2021 and 2023, a research initiative was undertaken to assess, rank, identify, and map sections of the watershed that are particularly susceptible to soil erosion. The RUSLE components for factors R, K, L, S, C, and P were integrated using the ArcGIS 10.4.1 spatial analyst's raster calculator tool to calculate and create maps that illustrate the risk and intensity of soil erosion in the Dhumuga watershed. The Dhumuga watershed was categorized into five groups based on average annual soil loss: 0–5 ton/ha-1 year-1 (very slight), 5–10 ton/ha-1 year-1 (slight), 10–20 ton/ha-1 year-1 (moderate), 20–50 ton/ha-1 year-1 (high), and > 50 ton/ha-1 year-1 (very high). The assessment of soil erosion severity was influenced by factors such as rainfall, soil type, DEM, land use, and land cover, employing the GIS-based RUSLE equation. The spatial risk of soil erosion was sorted into five categories based on severity, with 11.58% of the area categorized as very high risk (>50 ton ha-1 year-1), and 54.2% in the very low to low-risk category. On average, the watershed yielded an annual sediment production of up to 13.94 tons/ha/year, which is within an acceptable range. Considering these research findings, GIS-based analyses can be utilized to pinpoint areas at risk of soil erosion and identify vulnerable zones, offering crucial insights for future soil conservation and model enhancement.
},
 year = {2024}
}
TY  - JOUR
T1  - Spatial Assessment of Soil Erosion Risk Using RUSLE and GIS in Dhumuga Watershed, Ambo, Ethiopia

AU  - Diriba Megersa Soboka
AU  - Mekin Mohammed
Y1  - 2024/11/29
PY  - 2024
N1  - https://doi.org/10.11648/j.ajese.20240804.12
DO  - 10.11648/j.ajese.20240804.12
T2  - American Journal of Environmental Science and Engineering
JF  - American Journal of Environmental Science and Engineering
JO  - American Journal of Environmental Science and Engineering
SP  - 100
EP  - 106
PB  - Science Publishing Group
SN  - 2578-7993
UR  - https://doi.org/10.11648/j.ajese.20240804.12
AB  - Soil erosion has become a critical problem leading to land degradation and environmental risks globally. To grasp the rates of soil loss and identify the main factors driving these issues, it is vital to examine the specific impacts of soil erosion across different locations. Therefore, between 2021 and 2023, a research initiative was undertaken to assess, rank, identify, and map sections of the watershed that are particularly susceptible to soil erosion. The RUSLE components for factors R, K, L, S, C, and P were integrated using the ArcGIS 10.4.1 spatial analyst's raster calculator tool to calculate and create maps that illustrate the risk and intensity of soil erosion in the Dhumuga watershed. The Dhumuga watershed was categorized into five groups based on average annual soil loss: 0–5 ton/ha-1 year-1 (very slight), 5–10 ton/ha-1 year-1 (slight), 10–20 ton/ha-1 year-1 (moderate), 20–50 ton/ha-1 year-1 (high), and > 50 ton/ha-1 year-1 (very high). The assessment of soil erosion severity was influenced by factors such as rainfall, soil type, DEM, land use, and land cover, employing the GIS-based RUSLE equation. The spatial risk of soil erosion was sorted into five categories based on severity, with 11.58% of the area categorized as very high risk (>50 ton ha-1 year-1), and 54.2% in the very low to low-risk category. On average, the watershed yielded an annual sediment production of up to 13.94 tons/ha/year, which is within an acceptable range. Considering these research findings, GIS-based analyses can be utilized to pinpoint areas at risk of soil erosion and identify vulnerable zones, offering crucial insights for future soil conservation and model enhancement.

VL  - 8
IS  - 4
ER  -
Ethiopian Institute of Agricultural Research, EIAR, Ambo Agricultural Research Center, Ambo, Ethiopia
Ethiopian Institute of Agricultural Research (EIAR), Fogera National Rice Research and Training Center, Bahir Dar, Ethiopia
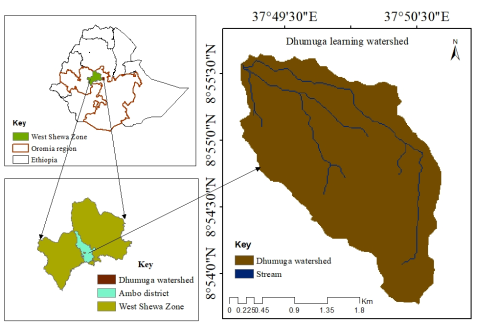
Figure 1. Location Map of Dhumuga learning watershed.
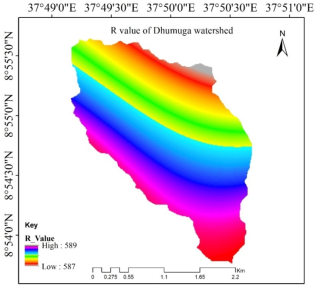
Figure 2. Erosivity factor map of the study area.
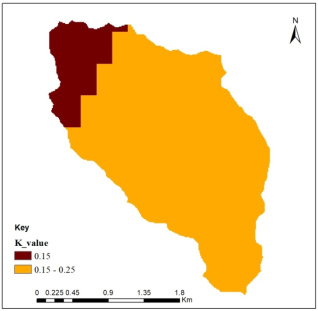
Figure 3. Map of soil erodibility factor of the study area.
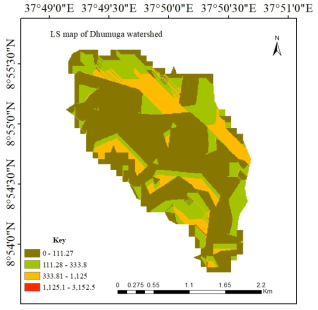
Figure 4. LS value Map of the study area.
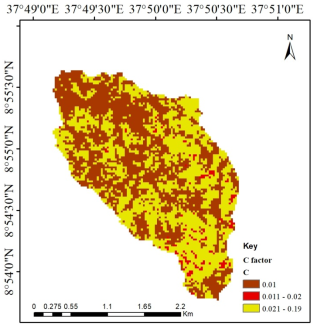
Figure 5. C value Map of the study area.
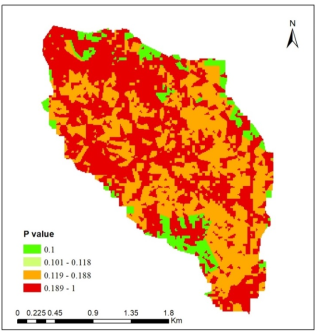
Figure 6. Erosion management practice (P) factor value Map of the study area.
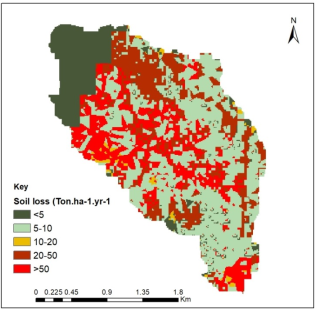
Figure 7. The spatial distribution of soil loss in Dhumuga watershed.